IRP&E’s uses Power BI to present interactive reports that allow faculty and staff to sort and filter student, course, degree, and faculty/staff data in a variety of ways to help inform conversations. These reports all require a CSU net ID login and are only accessible to faculty or staff (students need to have the Microsoft licensing upgraded to access the reports, which comes with a fee). We don’t have any trainings up on the tool, but the report structure has stayed consistent across the variety of BI tools we have utilized recently. If you do have any questions on the data or how to use the tool, please reach out to myself or any of my IRP&E colleagues.
The first report I am going to review is an employee headcount and Full Time Equivalency report. These data can be filtered by fiscal year, division, department, or by employee type. This allows folks to review data for their unit or for a certain employee group. The data can be sorted (across as columns or vertically by rows) by a variety of employment (division, department, full time/part time, employment type or faculty rank) or demographic (gender, ethnicity, racially minoritized status) characteristics. The data in the table below can be downloaded into excel if you click on a cell in the table and then on the “…” that will appear in the right-hand corner to “export” data. I recommend exporting as “summarized data” so you can play with the crosstabs by using a pivot or if you want a copy of the table in excel then download “data with current layout”.
This first table shows employment group headcount (e.g. state classified, administrative professional, faculty, graduate assistant, and other salaried ) by gender over time. From these data we can see that the representation of female-identified faculty has increased from about 46% in 2014-15 to 51% in 2023-24 (a 5 percentage point increase).

Subsequently, in the second table, I filtered the data by faculty and added “employment type” as the second sort and gender as third sort down. From these data, we can see that female representation is much higher among contract, continuing, and adjunct (CCA) faculty compared to tenure-track/tenured (TTT) faculty. However, among CCA, faculty the representation of female-identified faculty has been steady, around 60% between 2014-15 and 2023-24. Interestingly, female representation has increased among TTT faculty (about 6 percentage points), from 37% in 2014-15 to 43% in 2023-24. Additionally, the percent of faculty that are CCA has increased from 40% in 2014-15 to 48% in 2023-24 (about 8 percentage points).
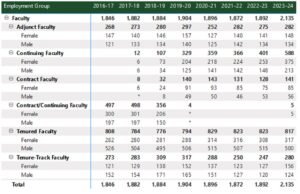
My interpretation is that the increase in representation of female-identified faculty is because representation among CCA faculty has increased as well as among TTT faculty. However, female faculty remain underrepresented among TTT faculty when compared with CCA faculty. The IRP&E data don’t shed much light on why CCA representation among faculty has increased or why female representation is higher among CCA faculty. These data points can inform our campus conversations about equity. These data can be disaggregated down to the college or department level and are provided in diversity blueprints to encourage units to explores patterns of representation and discuss institutional culture and structures that might support faculty that are historically underserved by higher education.
Author Information: This blog post was written by Heather Novack. Heather is the director of Institutional Research and a member of the Faculty Success Team.